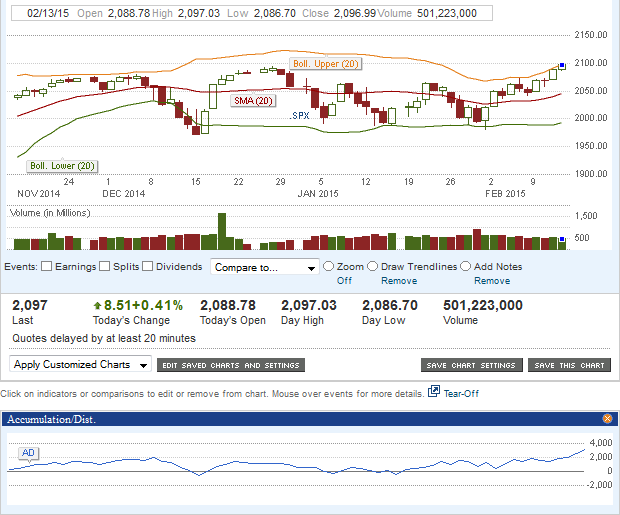
The SP500 has broken out and above its recent trading channel, heading to an all-time record high of 2097. The Dow Jones index is above a psychological 18,000 level, and the Nasdaq-100 index is very close to its all-time high of ~5000 made during the internet bubble Y2K. Markets are cheering something with diminished volatility; perhaps a good earnings season, that beat diminished expectations due to the strength of the dollar against other world currencies.
The chart above shows this state of affairs: the SP500 Accumulation/Distribution indicator is rising with the index. There is more buying than selling…though trading volume is about average. Strong volume is a necessary confirmation of a decisive move. A break-out and close for the index value beyond Bollinger Band limits is similarly helpful in determining continuation of a new trend. These indications are not seen; one may say that the upward move is tentative. Market Bulls will explain that away as diminished volume before a long weekend (the coming Monday is a national holiday for Presidents Day) here.
As always, there are all sorts of interesting predictions…more are bullish, favoring a rising market. One such view, referring to Fig. 2 below, points to lows in VIX call option contracts as reflective of a few months’ diminishing volatility.
Flip side arguments, to the volatility trend indicated in Fig. 2 above, include the fact that in two of three cases above, VIX rose sharply immediately after such lows, in VIX call option contracts, were registered. One may also note that the present situation, at a possible top of an extended bull market, or after a long period of diminished volatility and short-term rising volatility, is akin to that in late 2007.
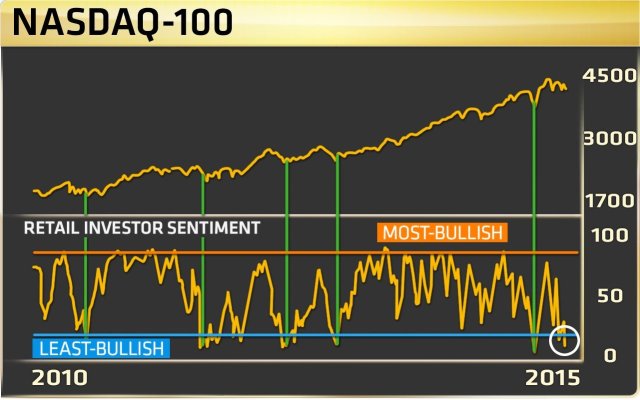
Another such bullish view points to retail investor sentiment being the least bullish in the near past as an indication of a possible rise in the near future. Fig. 3 below shows this for the Nasdaq 100 index.
Note that Fig. 3 plots the index for the bull phase of the markets over the past five years. In such a rising market, one may point to any condition of the indicator (retail investor sentiment in this case) and associate it with the desired upward market action. For instance, note, in Fig. 3 above, that rising segments of the index plot correspond with high retail investor sentiment near the “most bullish” level.
It is said that retail investors are the last to jump into a perceived rising market before it corrects substantially. It is also reasonable to assume that retail investor sentiment may be quite bullish as they pile on… A “least bullish” indication then may be associated with minimal participation by such investors.
Yet, note that retail investor sentiment fell in response to market falls in at least four instances in Figure 3, or it fell as a result of high volatility, as seen in the early 2010, and in the present. This most recent fall, in retail investor sentiment, could therefore be more due to extreme swings in the market seen at a possible top of an extended bull market – the jagged nature of the recent fall in retail investor sentiment appears to attest to this possibility. It is therefore just as reasonable to see the fall in retail investor sentiment as an effect rather than a cause for the unknown next phase of the market.
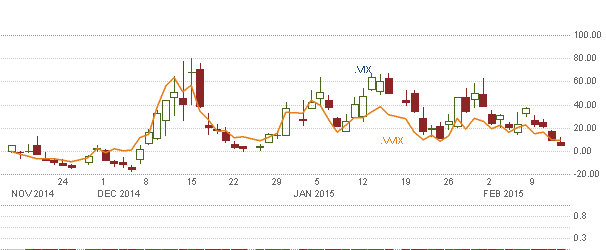
So what does all this mean, you ask? I took a look again at the VIX and VVIX (volatility of volatility) to get a sense of where things may go.
Other than that both fear and sensitivity to the fear index are at near-term lows, Fig. 4 does not provide me with any more insight. Geo-political concerns for the market such as Grexit, Ukraine, and economic concerns with commodity price swings and a strong dollar remain as detractors to rampant bullishness. Most recent economic indicators in the US, released this past week, have also not been promising, with jobless claims rising, and consumer sentiment falling more than expected. Besides, the FED raising interest rates mid-2015 is a higher probability now, given two voting members voicing their support for such move, which should also be a headwind for the markets.
I have, therefore, added to my long VIX positions.
~~~~~~~~~~~~


